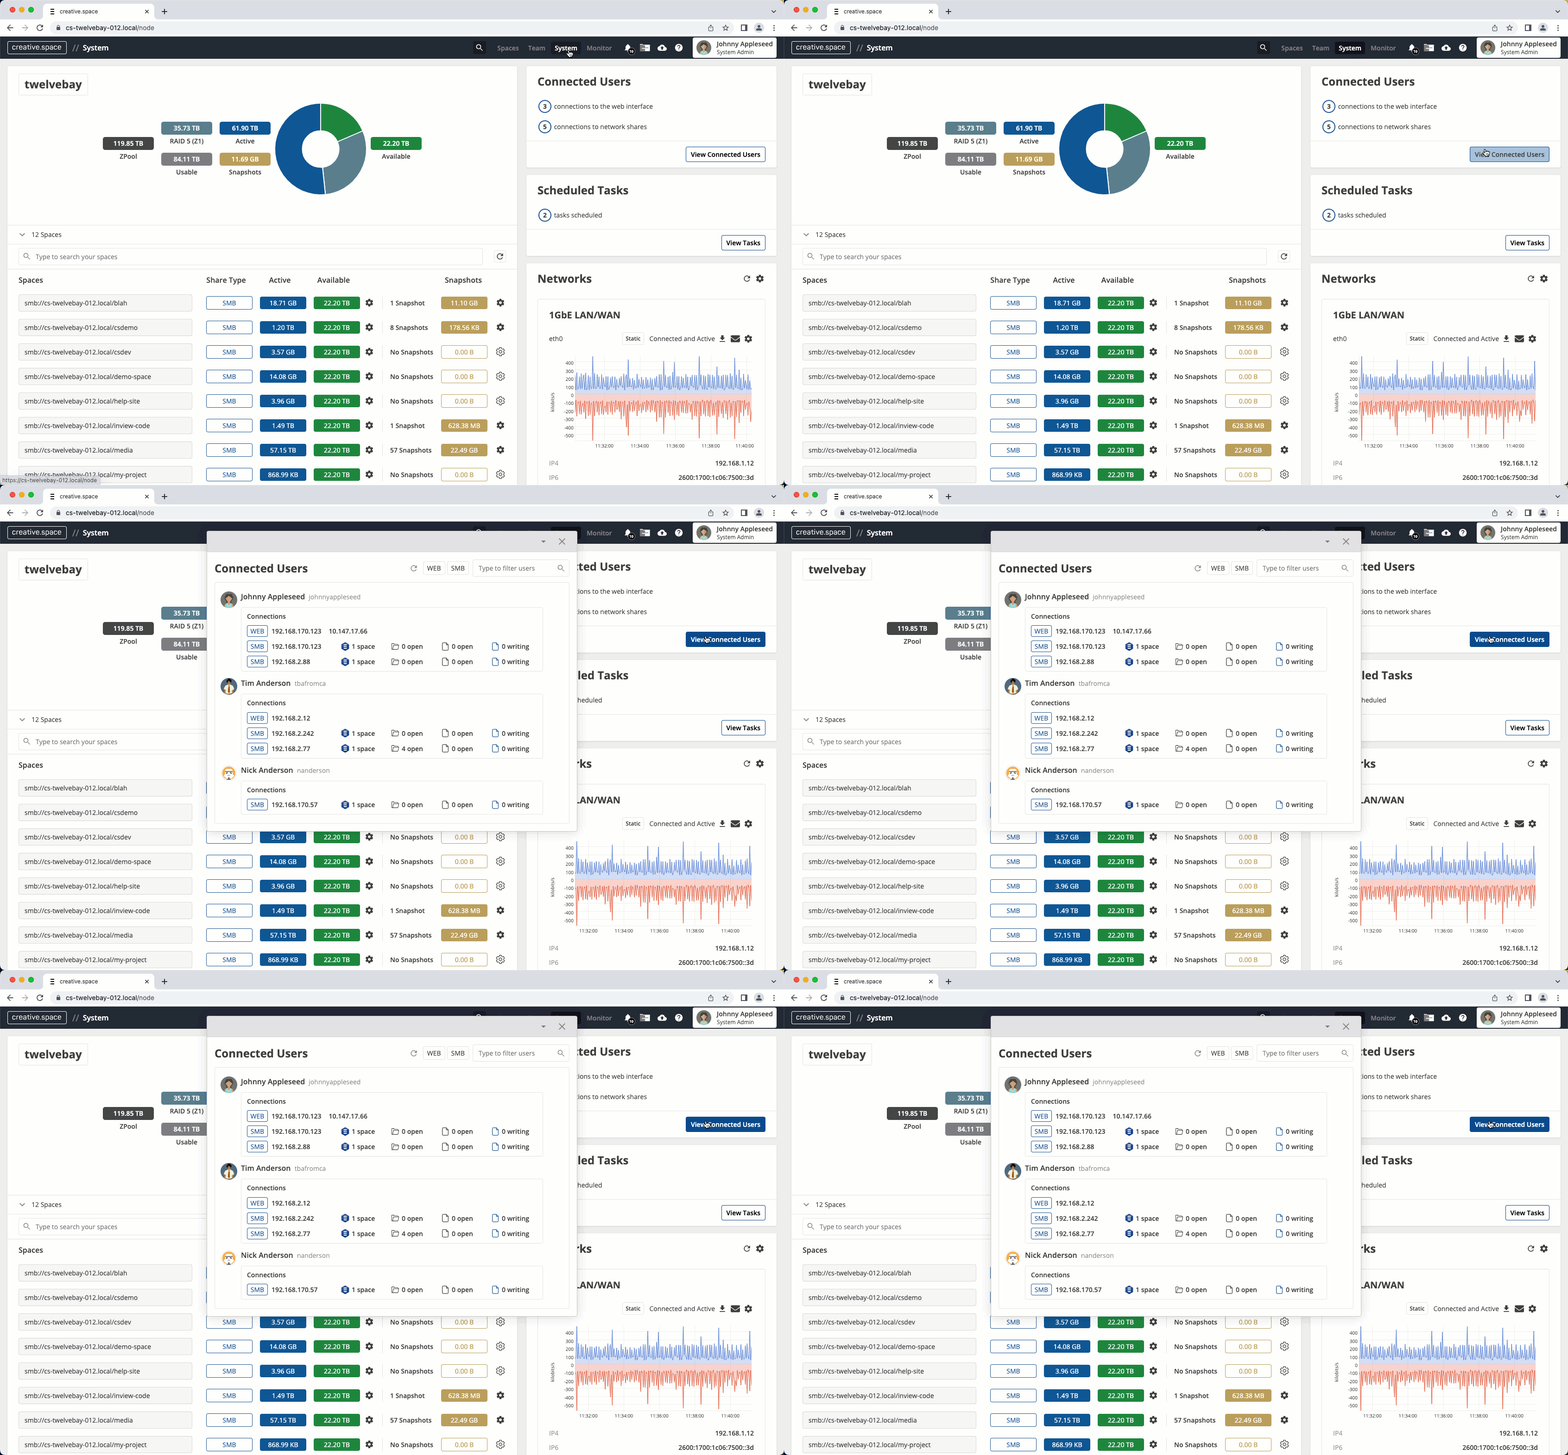
Visualize system health and receive alarms based on over 2000 metrics collected every second.
2000+ metrics. Simple dashboard displays intuitive charts for identifying system activity.
Alarm triggers. Internal and external proactive support teams when potential issues arise.


Quickly troubleshoot. Easily identify which connection is being used via a chart for each network interface that updates in real-time showing current activity.
Desktop. See what spaces, folders, and files users are accessing via SMB, including files referenced by creative applications.
Web. See who is logged into the web app, their IP address, and the IP address they are using to access the server.


Divide your storage into shared Spaces to collaborate in.

Manage Users, Groups, and Roles to control access.

Fill out forms to create folder structures and permissions.

Capture 2000+ metrics every second that trigger alarms.

Read-only copies for restoring deleted and modified files.

Extend your network with secure VPN integrations.

Blazing fast performance via software-defined storage

Mount Spaces with the click of a button without an IP address.
See all features